Ratio Analysis of the Consolidated Financial Statements
The purpose of this document is to facilitate the analysis of the Consolidated Financial Statements of Corporación Nacional del Cobre de Chile, for the year between January 1 and December 31, 2010 and the corresponding comparison with 2009.
In that sense, it should be understood as a supplementary report to the consolidated financial statements and their notes and it must be read in conjunction with them in order to gain a full understanding of the issues set forth.
I – ANALYSIS OF THE OPERATING RESULTS
1. 1. Production
As of December 31, 2010, the total copper production of Codelco Chile, generator of 92% of the total revenues of the period, reached ThFMT 1,688, representing a decline in production of -0.8% compared to 2009.
At divisional level, such behavior is explained by an increase in the production of operating divisions such as Chuquicamata, Radomiro Tomic and Salvador, which aggregated contribution significantly neutralizes the declines in production recorded in the Andina and Gabriela Mistral divisions. The Teniente division maintains a stable contribution to the production.
This aggregated productive behavior represents a significant management effort towards adverse factors presented in the mining operation such as the decrease in ore grade, increased rock hardness, increased depth of ore deposits and the resulting increased transport distances, among others.
2. Volume of physical sales
Sales, expressed in fine metric tons of own and third-party copper and molybdenum are detailed as follows:

 Compared to 2009, total copper dispatches during 2010 present a slight decrease in sales of own copper produced from the mineral resources of Codelco’s ore deposits (MFMT -42.1 ; -2.45%). The effect of the higher amount of physical dispatches of cooper purchased to third-parties (MFMT + 5.4; + 3.45%), is a factor that accompanies the increase in revenues arisen between the abovementioned periods as a result of the increase in copper prices observed in the market1. On the other hand, the dispatched volume of molybdenum remains stable. Revenues from the sale of this by-product increased mainly due to the higher price effect.
(1) LME copper price for the periods Jan-Dec 2010 and 2009: cUS/lb 341.98 and 234.22 respectively.
3. Profit for the period (expressed in millions of U.S. dollars, MUS$)
The chart above shows the behavior of Codelco’s Statement of Income – duly standardized under the IFRS framework – as of December 31, 2010 and 2009, respectively. The first aspect that should be highlighted is the notorious influence of copper price and, to a lesser extent, although important, of the by-products (mainly Molybdenum), whose increases noted in the market from the middle of the second half of 2009, have a significant influence on the generation of greater revenue, where the absolute increase is mainly explained by those revenue from copper.
In its turn, the gross profit as of December 31, 2010 amounted to MUS$ 6,977, which is greater by MUS$ 2,082 to the amount recorded during the same period of 2009, which is mainly explained by an increase in sales revenue, offset by greater production costs, attributable to monetary factors (such as the adverse effect of the exchange rate on costs denominated in domestic currency), combined with increases in the price of supplies and increased complexity in mining exploitation. The latter, in regard to the variation in costs among the periods under review, is indicated in the chart as follows:

 4. Other income and expenses by function
Other expenses and income by function (net effect) of MUS$ -1,917 as of December 31, 2010, includes MUS$ -1,311 related to Law No.13.196 with a tax of 10% on the return from exports of copper and byproducts.
5. Surpluses, profit (loss) before taxes and net profit (loss)
As of December 31, 2010, Codelco’s surpluses (profit (loss) before taxes and Law No. 13.196 tax) amounted to MUS$ 5,799, which were by far greater than the sum of MUS$ 3,947 at the same date of 2009, mainly due to an increase in gross profit of MUS$ 2,082 indicated above.
Likewise, the profit before taxes amounted to MUS$ 4,488 whereas net profit amounted to MUS$1,876, which represents yield on assets and equity – accumulated as of December 31, 2010 – of 9% and 41%, respectively. However, the Company’s tax burden, which, in 2010 is in the order of 62% on surpluses before taxes. Within this context, the yield on assets and equity, without considering the tax burden, Law No.13.196 tax, interest, depreciation and amortization, amounts to 37% and 164%, respectively.
II – STATEMENT OF FINANCIAL POSITION
From total assets as of December 31, 2010, close to 29% relates to current asset items, whereas the remaining percentage is composed of non-current assets, from which “Property, Plant and Equipment†is equivalent to 86%.
As of December 31, 2010, current liabilities represent 26% of liabilities and equity. Non-current liabilities and equity represent 52% and 22%, respectively.
1. Assets
As of December 31, 2010, current assets amounted to MUS$ 5,951, mainly composed of Inventories of MUS$ 1,783 (30%), Trade and other receivables of MUS$ 2,714 or 46%, Cash and cash equivalents of MUS$ 874 (15%), Other current financial assets of MUS$ 195 or 3% and the difference is comprised by other current asset accounts.
The increase in inventories compared to December 31, 2009 is due to isolated and seasonal physical increases in inventories of products-in-process and finished products, which were also affected by valuations where it has influenced the increase in costs attributable to the exchange rate variation and greater actual payroll costs because of the effect of collective negotiations in certain divisions. In addition, materials in warehouse record a seasonal variation the size of which does not represent the behavior of the trend in this variable.
The detail of inventories at the end of the half is as follows:
The chart below includes the comments on property, plant and equipment items as of December 31, 2010:
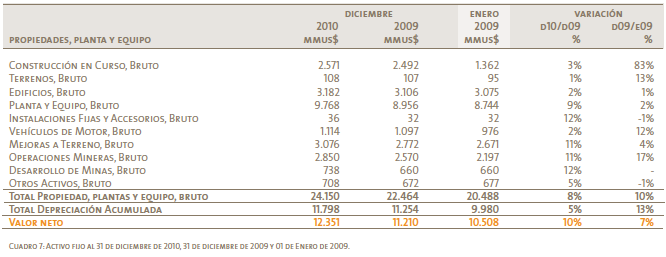
In net terms, there was an increase of MUS$ 1,141 compared to the balance existing as of December 31, 2009. This change in property, plant and equipment corresponds to the execution of Codelco’s investment program, which starts having a growing pace due to the effect of structural projects (aiming at maintaining and/or replenishing or increasing, the operating divisions’ productive capacities).
In addition, accumulated depreciation increased during 2009 due to the depreciation of the revaluation of property, plant and equipment items performed on January 1, 2009 as part of the transition to IFRS.
2. Liabilities
As of December 31, 2010, current liabilities amounted to MUS$ 5,244 (MUS$ 4,097 as of December 31, 2009) and is composed of other current financial liabilities of MUS$ 1,919 (37%), trade and other payables of MUS$ 1,803 (34%), current provisions for employee benefits of MUS$ 689 (13%) plus other miscellaneous liabilities.
As of December 31, 2010, non-current liabilities amounted to MUS$ 10,504 (MUS$ 9,714 as of December 31, 2009), mainly composed of other non-current financial liabilities of MUS$ 7,189 (68%), non-current provisions for employee benefits of MUS$ 1,191 (11%), a deferred tax liability of MUS$ 711 (7%), other long-term provisions of MUS$ 1,057 (10%) plus other non-current liabilities.
Other current and non-current financial liabilities within liabilities include financial obligations with banks, financial institutions and bonds payable issued in the local and international market.
Movements in obligations with banks and financial institutions between January 1 and December 31, 2010 relates to the accrual of financial interest. In regard to provisions, Codelco has recorded payment commitments for future benefits agreed with its employees, as well as those which might arise from litigation related to management activities. These have been classified as current and non-current depending on their estimated payment term.
As of December 31, 2010, equity amounts to MUS$ 4,531 (MUS$ 4,443 and MUS$ 4,564 as of December 31, 2009 and January 1, 2009, respectively), which includes an extraordinary capital contribution of MUS$ 1,000 received during 2009 as provided by transitional Article 6 of Law No. 20.392. In addition, it includes a reserve fund of MUS$ 500 and a provision for dividends payable of MUS$ 173.
III – FINANCIAL RATIOS
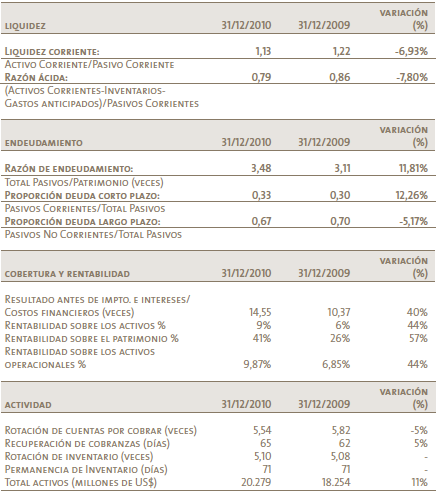
As of December 31, 2010, liquidity ratios decreased compared to December 31, 2009 due to a net increase in current assets of 28%, mainly due to an increase in shortterm financial debt balance of, which was the subject of refunding through the issue of long-term bonds and current provisions for employee benefits.
As of December 31, 2010, Codelco’s total indebtedness amounted to MUS$15,748 (MUS$13,811 as of December 31, 2009), which reflects an increase of MUS$1,937 between both periods. The percentage increase in the indebtedness ratio is mainly explained by an increase in long-term debt bonds payable issued by the Corporation as of December 31, 2010.
IV – STATEMENT OF CASH FLOWS
Net cash flows from operating activities for the year ended December 31, 2010 determined a positive cash flow of MUS$3,262, which is lower by MUS$-13 compared to the same period of prior year, mainly because an increase in the payment of income taxes directly related to the increase in revenue obtained by Codelco due to the effects of the prices of copper and molybdenum.
Cash flows from operating activities highlight the following:

On the other hand, financing activities for the year ended December 31, 2010 resulted in a negative flow of MUS$-857 compared to the negative flow of MUS$-1,176 generated during the same period of prior year, which is mainly explained by the payment of dividends to the Chilean Treasury as of December 31, 2010.

Finally, investment activities generated a net negative cash flow of MUS$-2,304 as of December 2010, which is greater than the negative flow of MUS$-585 in the same period of prior year. Figures for January-December 2010, show the significant investment levels which the Corporation has been making during the last year for the development of projects which are relevant for Codelco.
Considering cash flows indicated above plus opening cash balances as of December 31, 2010, Codelco obtained final cash and cash equivalents balance of MUS$874, which is greater than the balance of MUS$773 determined at the end of the January- December 2009 period.
V – MAIN DIFFERENCES BETWEEN THE CARRYING VALUE AND THE MARKET OR ECONOMIC VALUE OF CODELCO’S ASSETS
Codelco’s deposits are recorded in the accounting records in conformity with the industry’s customary policies at a nominal value of US$1 each, which naturally implies a significant difference in their carrying value compared to the actual economic value of these deposits.
This generates the effect that equity for accounting purposes and assets are a subgroup of the Corporation’s economic value.
VI – INFORMATION ON MARKET AND COMPETITION
Codelco is the World’s biggest producer of copper with worldwide share of 11% of the World’s production and a third of domestic production during 2010. In addition, Codelco has the World’s biggest reserves of copper, contained in world class deposits and is one of the biggest producers of molybdenum.
Codelco has six mining divisions, Chuquicamata, Radomiro Tomic, Salvador, Andina, El Teniente and the recently incorporated Ministro Hales division, which is currently under construction. The Ventanas Division (Smelter and Refinery) and the subsidiary Minera Gaby S.A. are also added to these divisions. In addition, the Corporation has 49% interest in Sociedad Contractual Minera El Abra and has interest in different companies focused on technology exploration and development.
Over the last 20 years, the total amount of contributions by Codelco to the Chilean Treasury exceeded MUS$57 expressed in 2010 currency representing 11% of the Central Government’s revenue. During the same period, Codelco represented a fifth of Chilean exports and its investments were equivalent to 80% of the total foreign investment in mining (Decree Law No. 600).
In addition to its direct contributions to Chilean development, Codelco generates a significant amount of clusters.
During 2010, the Corporation had more than 3,800 suppliers, 90% of which were domestic suppliers. In addition, Codelco is the biggest electric customer in Chile and has a significant role in the development of new sources of energy and renewable, non-conventional energy projects.
During 2010, Codelco implemented the new Corporate Government Law and adopted the institutional framework which includes the best worldwide practices in this matter. The new Corporation’s Board of Director appointed Diego Hernández as the Executive Chairman who took office of his position on May 19.
During 2010, the average price of copper was US¢ 342 per pound, recording an increase of 46% compared to the prior year. This increase was within the context of a deficit in the market with dynamic consumption thanks to the impulse in China and recovery by the Advanced Economies, as well as a copper supply able to respond to such demand. On the other hand, the quoted price of molybdenum increased from 24.5 US$/kg in 2009 to 34.8 US$/ kg in 2010.
Market perspectives in the medium and long-term continue to be promising. The ongoing recovery of the worldwide economy, the expected growth in China and other Emerging Economies, which are at development stage with intensive use of copper and new uses and applications for copper might sustain consumption growth at a pace greater than the historical average. In regard to supply perspectives, the aging and decreasing wealth of the current deposits, greater complexities of new projects and greater geopolitical risks of the new mining districts set up a challenging landscape.
In order to answer those challenges posed, the Corporation has defined a new Strategic Plan. A core priority for this Plan is the development of the most ambitious project portfolio in its history, which highlights the structural projects: Ministro Hales, Underground Chuquicamata mine, Mine New Level and Andina Development Plan Phase II. During 2010, the projects Radomiro Tomic Sulfides Exploration Phase I, Andina Development Plan Phase I, Pilar Norte (El Teniente) and Gaby Phase II commenced operations and the Ministro Hales project was approved.
Aiming more to the long-term, Codelco continues making its exploitation efforts at domestic and international level for maintaining and expanding its mining base.
The Corporation, aware of big competitive challenges for today and tomorrow, is working and promoting the development of innovations in mining and metallurgical processes and is implementing actions for generational change, as well as to attract, retain and manage talent.
Finally, Codelco has defined sustainability as one of its strategic objectives and priorities, including safety, occupational health, the environment, territory, community management, efficiency in the use of natural resources, and market defense and development.
VII – MARKET RISK ANALYSIS
Corporación Nacional del Cobre de Chile (Codelco-Chile) has created instances within its organization which search for generating strategies to minimize market risks to which the Corporation may be exposed.
For further analysis on this subject, please refer to Notes 26 and 27 to the Financial Statements.


